 EN
 SK


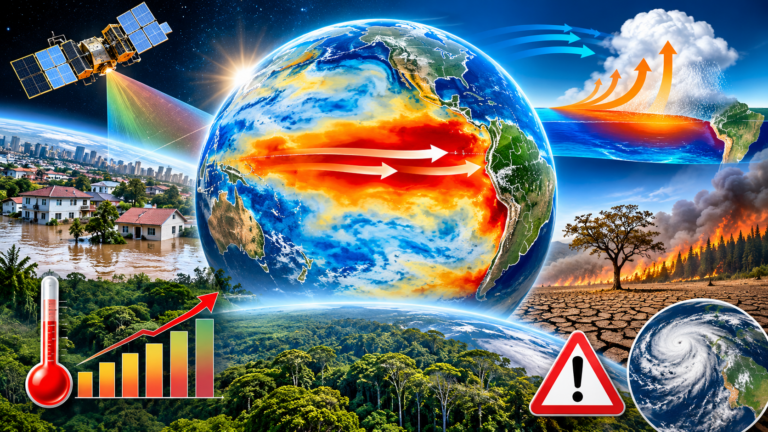
The equatorial Pacific is undergoing a dramatic transformation. Satellite measurements The US National Aeronautics and Space Administration (NASA) data from October 2026 confirm that there is a massive accumulation of heat in the central and eastern Pacific Ocean. The phenomenon El Niño, which returns to the global climate scene at irregular intervals of two to seven years, has picked up an unusually strong pace this time. The data collected shows that the current anomaly not only matches the magnitude and dynamics of the strongest recorded events of the modern era, but has the potential to surpass them.
Mechanism of ocean-atmosphere chain reaction
At the heart of every El Niño is a tightly coupled feedback loop between the ocean surface and atmospheric circulation. Under normal climate conditions, stable trade winds push warm surface waters westward, causing them to accumulate in the western Pacific, where the ocean surface is physically higher than off the coast of South America.
However, as soon as the trade winds weaken, the balance is disturbed. The accumulated mass of warm water begins to travel eastward in powerful pulses. This shift weakens the trade winds, in some cases even leading to their complete reversal. Atmospheric circulation thus allows the movement of additional masses of warm water, which intensifies the whole process. The result is a significant warming of the surface layers and a rise in sea level in the central and eastern equatorial Pacific.
35 years of satellite altimetry and latent energy measurement
Satellite altimetry is a key tool in tracking these changes. Because seawater physically expands as temperatures rise, unusually high sea levels in the tropics signal a huge accumulation of thermal energy. NASA's Earth Observatory, in collaboration with the Jet Propulsion Laboratory (JPL-Caltech), is using a comprehensive set of measurements that is unprecedented in the history of oceanography.
„What’s unique about altimetry is that we have a 35-year record from nearly identical satellites flying nearly the same Earth orbit, with each mission overlapping the next,“ explains Josh Willis, project scientist for sea level monitoring missions at NASA JPL. „That allows us to look back in time and compare this El Niño to what happened in 1997. And right now, this is on track to be even bigger.“
A continuous series of measurements were provided by the TOPEX/Poseidon, Jason-2 and most recently Sentinel-6 satellites Michael Freilich. The sea level anomaly maps, prepared by researchers Josh Willis, Severine Fournier and Kevin Marlis and cartographically rendered by Lauren Dauphin, have been stripped of normal seasonal cycles and long-term trends. The resulting visualizations show areas of above-average sea level in shades of red, while areas of below-average sea level in blue and white represent normal.
Comparison of three decades: 1997, 2015 and 2026
Although each El Niño event follows similar physical principles, the spatial distribution of warm water varies, which fundamentally affects the resulting weather patterns. Scientists therefore place the current observations in the context of two previous strong events.
| Tracking parameter | El Niño 1997–1998 | El Niño 2015 – 2016 | El Niño 2026 – 2027 |
| Primary satellite mission | TOPEX/Poseidon | Jason-2 | Sentinel-6 Michael Freilich |
| Onset and dynamics of development | Gradual increase in anomalies | Standard seasonal development | Extremely sudden and violent onset |
| Warm water range in the east | The mass reached the coast of South America directly | Warm water has stopped off the coast of South America | Warm water reaches right up to the coast of South America |
| Recorded and modeled impacts | Massive rainfall in California and southern US; drought in Africa | Rainfall in Central America, flooding in Mexico and the southeastern US | Increased risk of extreme rainfall and flooding |
As can be seen from a comparison of satellite images from mid-October of each year, the year 2026 developed much more rapidly than the event from 1997. Despite the faster onset, the spatial arrangement on October 12, 2026 shows an almost identical pattern to October 13, 1997. The slope of the Pacific surface – low in the west and high in the east – together with warm water hitting the South American continent creates a structure that did not occur in 2015. It was the absence of significant contact of warm water with the South American coast in 2015 that redirected the main precipitation fields over Mexico and Central America.
Global consequences and limits of predictability
Previous strong episodes have demonstrated the far-reaching impact that a shift in Pacific circulation can have. The events of 1997–1998 and 2015–2016 were accompanied by devastating forest fires in Indonesia and the Amazon, catastrophic droughts leading to crop failures in southern Africa, and torrential downpours associated with coastal flooding in Southern California.
The National Oceanic and Atmospheric Administration (NOAA) said in its forecast of October 8, 2026, that there is an 83 percent chance that a strong to very strong El Niño will last at least through the first three months of 2027. This probability puts meteorologists and emergency services on alert on several continents.
However, experts emphasize that even the precise coincidence of satellite maps does not guarantee identical weather patterns. The influence of ocean heat spreads through the chaotic atmosphere, where the original signal mixes with other local processes. Josh Willis reminds us that in the atmosphere there is always a certain „roll of the dice“ - although the current phenomenon is strikingly reminiscent of 1997, the weather behavior during the winter of 2026-2027 may develop in its own direction. However, continuous satellite monitoring provides the scientific community with an unprecedented advantage in early warning and preparedness for global risks. JRi&CO2AI

