 EN
EN  SK
SK 

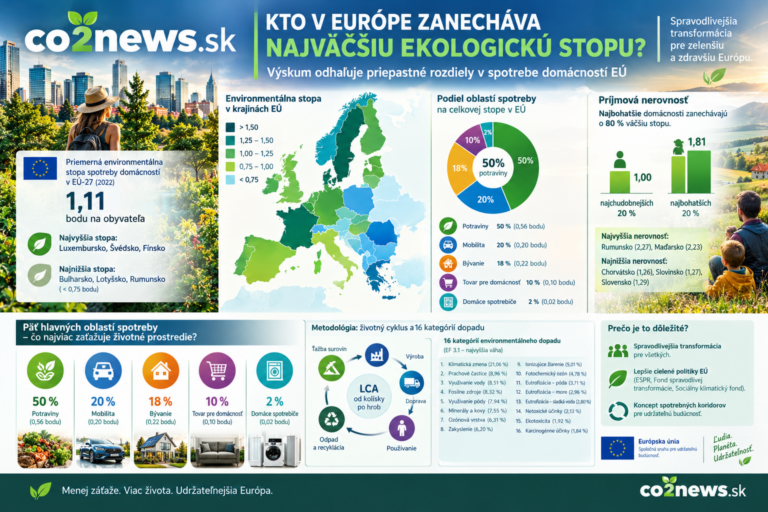
The European Union has set itself the goal of achieving climate neutrality by 2050 as part of the European Green Deal (European Green Deal). The key principle of this transformation is to leave no place or person behind (leave no person and no place behind). New study Joint research the European Commission's Joint Research Centre (JRC) in cooperation with the Directorate-General for Employment, Social Affairs and Inclusion (DG EMPL) within the framework of the project DISCO brings an updated methodology to measure and monitor inequality in the carbon and environmental footprint of household consumption in the EU. The research links microdata on household expenditure from the EU Household Budget Survey (EU-HBS) with a model of the environmental footprint of products (EU Consumption Footprint) across all 27 Member States.
Geographical differences: From Luxembourg to Bulgaria
The average environmental footprint of household consumption per capita in the EU-27 in 2022 is 1.11 points overall weighted score. However, there are significant differences between individual member states. Luxembourg, Sweden and Finland have the highest environmental footprintOn the contrary, Bulgaria, Latvia and Romania have the lowest consumption footprint, where it does not even reach 0.75 points.
In terms of the five main areas of consumption, the largest contributors to the overall footprint in the EU are:
- Food (50 % total impact): represent the largest environmental burden factor in the EU with a value of 0.56 points per capita. Spain has the highest food footprint (0.89 points, which accounts for up to 70% of its total footprint), followed by Portugal and Sweden.
- Mobility (20 % total impact): It averages 0.20 points per capita. The highest share of mobility in the total footprint is in Luxembourg (32 %, 0.48 points) and Cyprus (0.34 points).
- Housing (18 % of total impact): It averages 0.22 points per capita. Denmark has the highest housing footprint (0.42 points), with Slovenia and the Czech Republic also showing high values.
- Household goods (10 % of total impact): has an average value of 0.10 points per capita. Finland shows significantly higher consumption of household goods (0.20 points, or 16 % of its footprint).
- Home appliances (2 % of total impact): They have the smallest share with an average value of 0.02 points per capita. The highest share of appliances was recorded in Denmark (4 %, 0.05 points).
Income inequality: The richest leave an 80% bigger footprint
The main finding of the DISCOH study is the significant income inequality in the environmental impact of consumption. Households in the top income quintile (the richest 20 %) have an environmental footprint on average 1.81 times larger in the EU than households in the bottom income quintile (the poorest 20 %).
However, the extent of this inequality varies significantly across EU countries:
- Highest income inequality in the environmental footprint measures Romania (ratio 2.27) a Hungary (2.23), where the richest have more than double the footprint of the poorest. Bulgaria (2.16), Latvia (2.07) and Lithuania (2.00) also show high inequality.
- Lowest inequality was recorded in Croatia (1.26), Slovenia (1.27), Ireland (1.28), Slovakia (1.29) and Austria (1.31).
The analysis also shows a shift in the structure of the consumer basket by income:
- U the poorest fifth of the population (1st quintile) make up the vast majority of the footprint of basic necessities – food (52 %) a housing (24 %), while the mobility represents only 14 %.
- U the richest fifth of the population (5th quintile) the relative share of food decreases to 49 % and housing to 17 %, while mobility share grows to 21 %.
Methodological innovations and limitations
The DISCOH methodology uses LCA (Life Cycle Assessment) process approach covering 16 environmental impact categories Environmental Footprint (EF 3.1) methodology. The results are combined into a single weighted score using normalization and weighting. The model also uses dynamic evaluation, which takes into account temporal and geographical specificities, such as the national energy mix, wastewater treatment, or regional water shortages (AWARE model).
However, household budget surveys also have methodological limitations. These include partial coverage of services, the use of representative products, and the conversion of expenditures into quantities using national average prices (NAPs). If wealthier households purchase more expensive product variants, expenditure models may slightly overestimate their physical footprint. On the other hand, the imperfect capture of the highest incomes in surveys tends to compress the measured gap between groups.
Implications for European policies
DISCOH project findings serve as a basis for the development of just transition policies, including Social Climate Fund (Social Climate Fund), Just Transition Fund (Just Transition Fund) and European Observatory for Fair Navigation (European Fair Transition Observatory). The data also allow us to develop the concept „"consumer corridors"“ (consumption corridors), which explore how to achieve environmental sustainability while maintaining a decent standard of living for all residents. JRi&CO2AI

