 EN
EN  SK
SK 

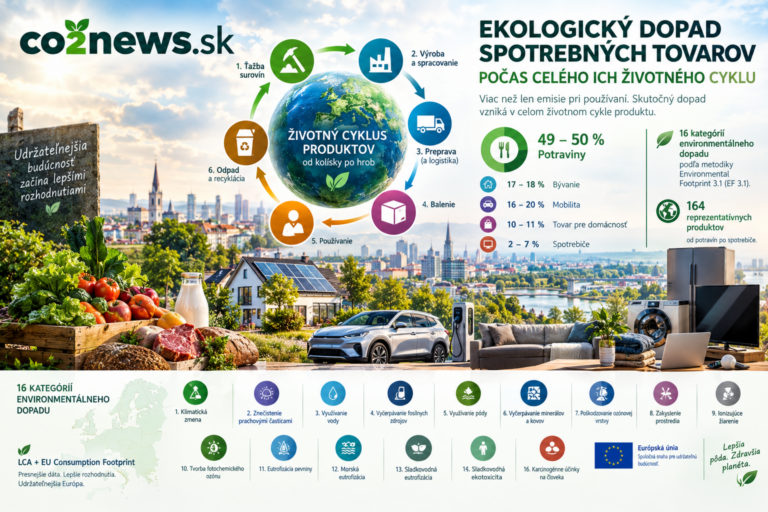
Traditional environmental impact assessments are often limited to direct emissions from product use – for example, fuel consumption when driving a car or electricity consumption when operating appliances. Comprehensive However, a sustainability perspective requires an assessment of the entire product life cycle from the cradle to the grave (cradle to grave). The European Commission's Joint Research Centre (JRC) has developed an indicator EU Consumption Footprint, which quantifies the total environmental pressure caused by consumption in the European Union, regardless of whether goods are produced in the EU or imported from abroad. This approach provides policymakers and the public with a comprehensive picture of where exactly in the supply chain the greatest environmental burdens arise.
LCA Methodology: Detailed Process Approach
The basic pillar JRC model is Life cycle assessment (Life Cycle Assessment – LCA), which is governed by the international standards ISO 14040 and 14044. Unlike economic macro-models (so-called. Multi-Regional Input-Output – MRIO), which aggregate data at the level of entire economic sectors, the JRC model relies on bottom-up process approach (bottom-up).
This detailed approach also allows for changes in consumer behavior within a single spending category – for example, switching from traditional light bulbs to energy-efficient LED lights will change the overall footprint even with the same financial budget. The model tracks overall 164 representative products divided into five main areas of consumption:
- Food (45 representative products): include meat (beef, pork, poultry), fish, dairy products, fruits, vegetables and beverages.
- Housing (30 building archetypes): covers the construction, maintenance and energy operation of homes.
- Mobility (34 types of vehicles and transport): includes passenger cars of various categories and fuels, buses, trains and air transport.
- Household goods (37 products): from furniture to textiles to cleaning products.
- Home appliances (18 products): refrigerators, washing machines, televisions, computers and lighting.
Each product is analyzed across all stages of the life cycle: from raw material extraction, through production and processing, international and local transportation, packaging and the use phase, to waste management and recycling [25, 30, 94–96].
16 environmental impact categories and planetary boundaries
Many ecological studies focus exclusively on carbon footprint and climate change. However, the JRC model uses a methodology Environmental Footprint 3.1 (EF 3.1), which evaluates 16 different environmental impact categories. This avoids the risk that a measure to reduce greenhouse gas emissions will inadvertently worsen another environmental problem, such as water depletion or soil acidification.
These 16 dimensions cover a wide range of pressures on ecosystems and human health [26, 88–91]:
- Climate change (Climate change): greenhouse gas emission rate expressed in kg CO₂ equivalent with the highest weight in the model (21.06 %).
- Dust particle pollution (Particulate matter): impact on human health and incidence of diseases (weight 8.96 %).
- Water use (Water usage): evaluated by the AWARE model taking into account water scarcity in a given region (weight 8.51 %).
- Depletion of fossil resources (Resource use, fossils): consumption of oil, natural gas and coal in MJ (weight 8.32 %).
- Land use (Land use): soil quality index taking into account land use and degradation (weight 7.94 %).
- Mineral and metal depletion (Resource use, minerals and metals): (weight 7.55 %).
- Ozone layer depletion (Ozone depletion): (weight 6.31 %).
- Acidification of the environment (Acidification): (weight 6.20 %).
- Ionizing radiation (Ionizing radiation): (weight 5.01 %).
- Photochemical ozone formation (Photochemical ozone formation): (weight 4.78 %).
- Eutrophication of land (Terrestrial eutrophication): (weight 3.71 %).
- Marine eutrophication (Marine eutrophication): (weight 2.96 %).
- Freshwater eutrophication (Freshwater eutrophication): (weight 2.80 %).
- Non-toxic effects on humans (Human toxicity, non-cancer): (weight 2.13 %).
- Freshwater ecotoxicity (Freshwater ecotoxicity): (weight 1.92 %).
- Carcinogenic effects on humans (Human toxicity, cancer): (weight 1.84 %).
After normalization and weighing, the individual indicators are combined into one total score (single weighted score), which allows the overall footprint to be evaluated also with regard to planetary boundaries (planetary boundaries).
Static versus dynamic model: Taking into account temporal and geographical shifts
A significant methodological advance in the latest applications of the JRC model is the transition from static calculation to dynamic modeling. While the static model applies the same technological parameters on average for the entire EU, the dynamic assessment adapts the product life cycle to the specific time and geographical context.
The dynamic model takes into account, for example [32, 94–96]:
- The country's energy mix: the national structure of electricity production in a given year (e.g. a higher share of renewable sources reduces the footprint of using appliances or electric cars).
- Regional water shortage: According to the AWARE model, consuming one liter of water in the dry Mediterranean (e.g. Malta) has a greater environmental impact than the same consumption in Finland, which has abundant rainfall.
- Feed diet composition of livestock and trade flows (ratio of domestic production to imports).
- Waste and wastewater treatment technologies in individual Member States.
Where does the biggest burden arise? The structure of the EU's consumption footprint
Based on a life cycle assessment, the overall environmental footprint of consumption in the EU-27 is unevenly distributed across sectors:
- Food forms the dominant part of the footprint (49 – 50 %): Agricultural production, fertilization, livestock farming and food processing represent the greatest pressures on land use, water consumption and greenhouse gas emissions.
- Housing (17 – 18 %): A significant share is played by building construction, energy intensity of heating and fuel consumption.
- Mobility (16 – 20 %): Dominated mainly by the production and operation of passenger cars and the consumption of fossil fuels.
- Household goods (10 – 11 %) and appliances (2 – 7 %): Although they represent a smaller percentage, the production of electronics and furniture shows a high intensity of use of minerals and metals.
Use in practice and European policy-making
Detailed knowledge of the environmental footprint of products is a key basis for the creation of EU legislation. It serves, for example, in prioritizing product groups within Ecodesign regulations for sustainable products (ESPR), monitoring Circular Economy Action Plan whether Zero Pollution Action Plan. Life cycle assessment thus allows for the precise identification of environmental „hot spots“ (hotspots) and propose measures that effectively lead to more sustainable production and consumption across Europe. JRi&CO2AI

